Gold Update – Capital Flowing into Precious Metals
In the last post in December last year, I showed Gold breaking out versus the NASDAQ tech sector.
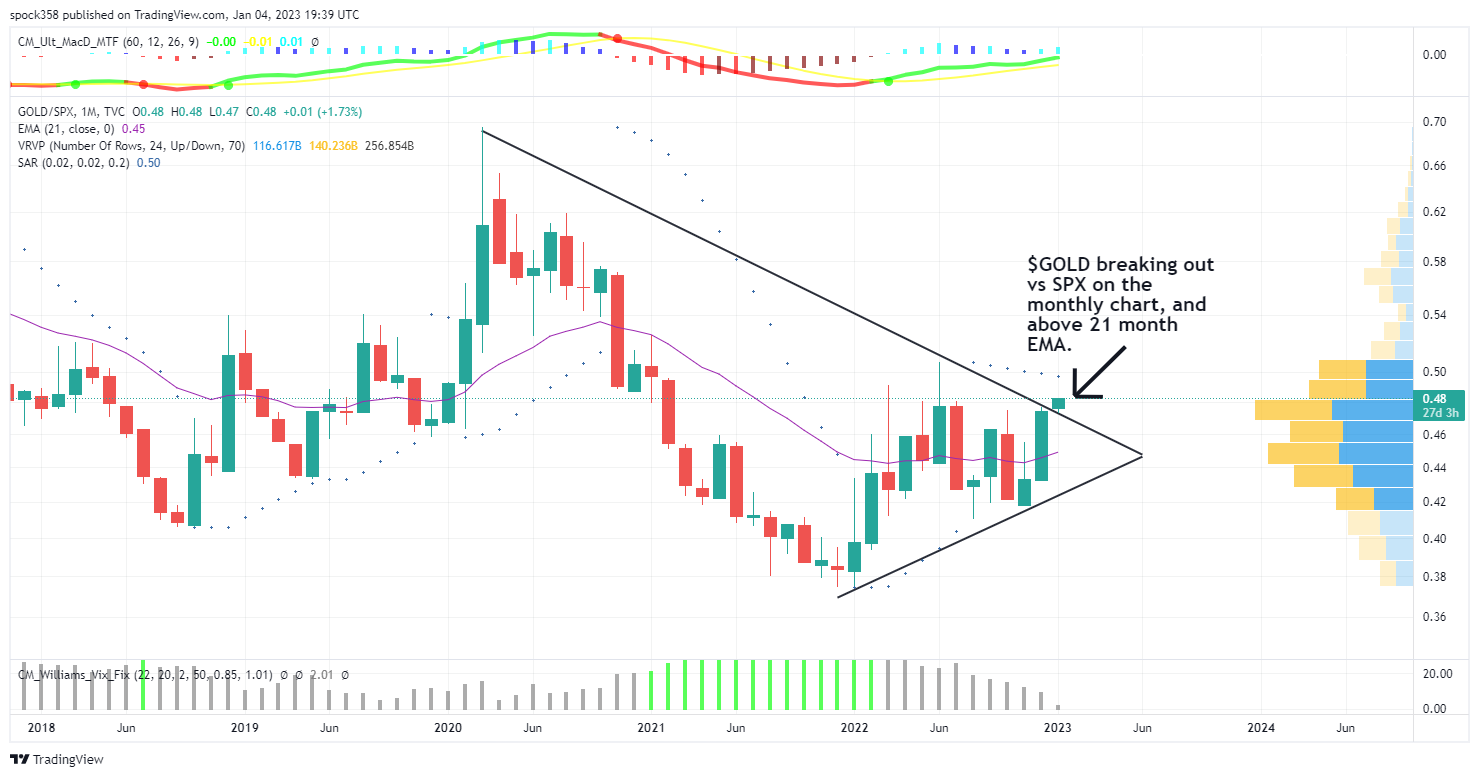
This month gold has broken out higher versus the S&P 500 index. Silver is leading, as it broke out higher versus the S&P 500 index last month.
This is significant, as it means capital is flowing out of equities now, and into precious metals.
We are in the very early stages of a precious metals bull market. As the capital flows increase into this sector, the miners are going to take off. I will update all the gold and silver miners in the portfolio this weekend.
Strap in. 2023 is looking like a big year for precious metals, as there is a lot of capital out there, and the PM sector is tiny.
Spock 😉
Precious Metals Update
Gold – major shift underway
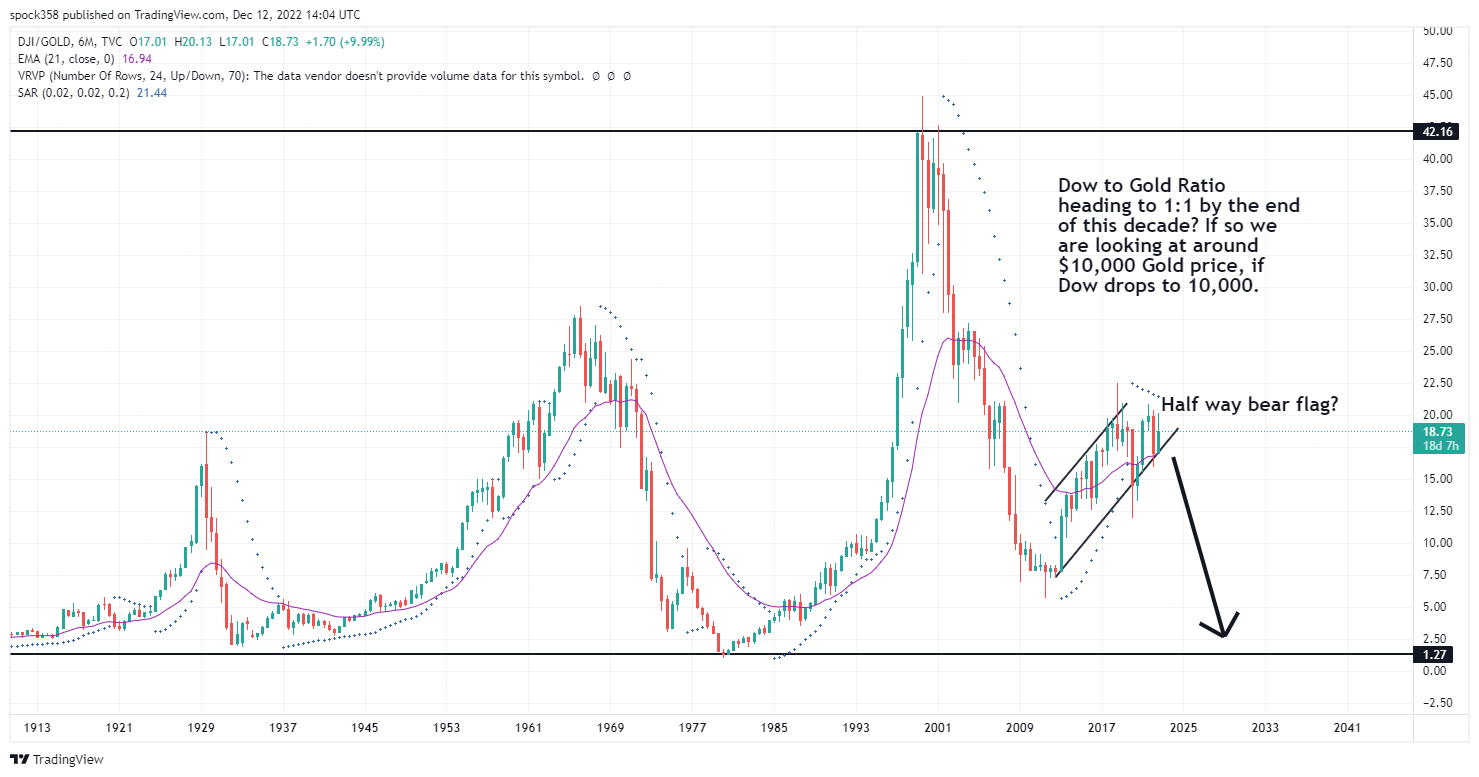
Dow Gold Ratio Chart
Here is long term chart of Dow vs Gold, which is a long term downtrend now for the next 10 years. A bear flag has formed here, and once this breaks down, the ratio is heading to 1:1. For example, Dow 10,000 (70% drop) which I expect from 2025 to 2027 Great Depression and Gold $10,000, as the sovereign bonds default.
This is a 100 year chart going back to early 1900s. Each candle is 6 months. And the macro picture is clear. Very clear.